
The new DataSelf Analytics interface – powered by Tableau 9.3 – lets business people stay in the flow with their data. Users work smarter and faster than ever. Ask your questions, get your answers, and discover questions you didn’t even know you had. Below, you’ll see a sample of valuable new features.
Check out the Tableau Releases Notes
Related article:
The new DataSelf Analytics 9, self-service BI, complete and polished
DataSelf Analytics 9.2

Empower your organization with new tools for content discovery, governance, and management.![]()
Search
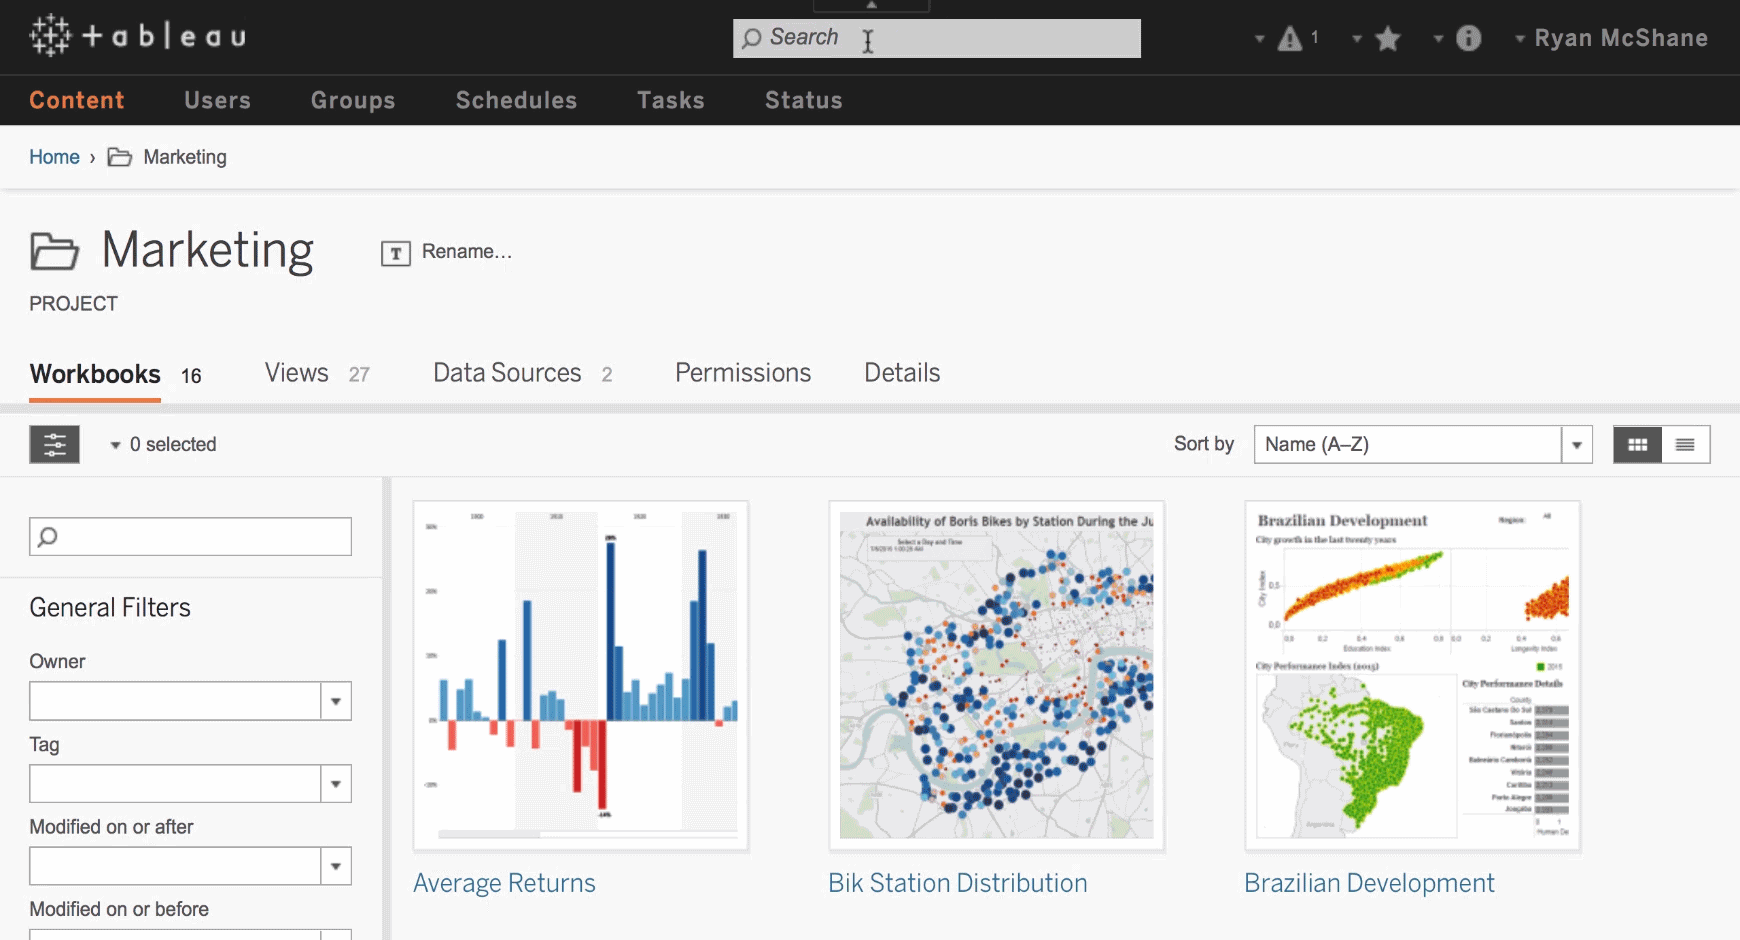
Search now shows you the most popular workbooks and views first.
____________________________________________________________
Content Analytics
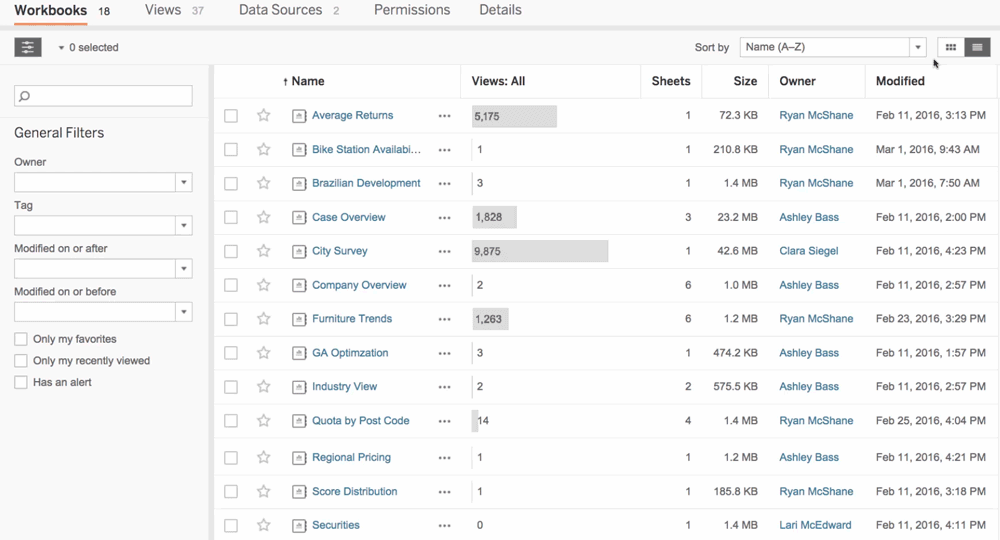
Find popular workbooks and views by seeing how many views they have received.
____________________________________________________________
Versioning
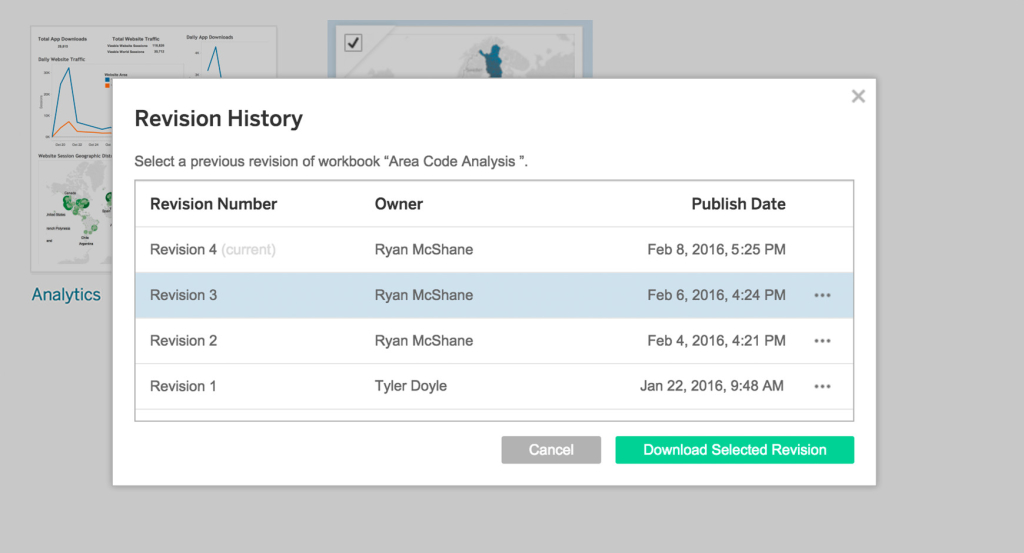
Changes didn’t work out like you planned? Don’t worry! Just download the
old version and keep going with Workbook Revision History for Tableau Server.
____________________________________________________________
Content Management
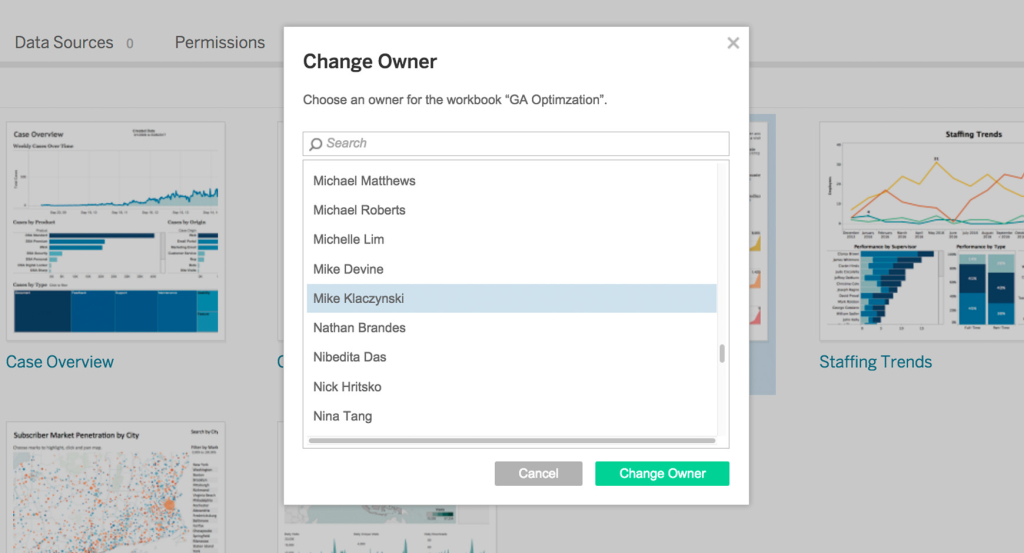
Project leaders can now change owners, run refresh schedules, and move content.
____________________________________________________________
Tableau Server Management
Rest API Enhancements
The REST API is underpinned by a completely new platform with significant performance and usability improvements for admins.
Low Disk-Space Monitoring
Don’t unexpectedly run out of space. Tableau Server now lets you specify disk-space thresholds that alert you when space runs low.
Postgres Connectivity Monitoring
You can now check the underlying PostgreSQL database for corruption with a new tabadmin command.
PostgreSQL Improvements
Fail over from one repository to another much more quickly. No server restart required.

Publish Data Source
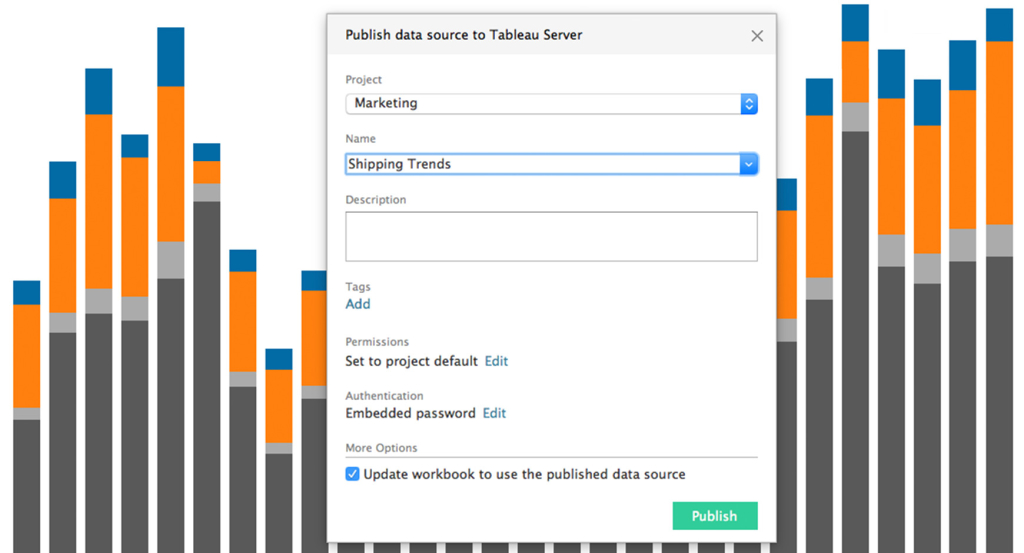
It’s easier to publish, keep your data fresh, and stay connected
with the new Publish Data Source flow.
____________________________________________________________
Mobile Sign-in

Getting started with your data should be fast, no matter where it lives or how it looks.
____________________________________________________________
Always Connected
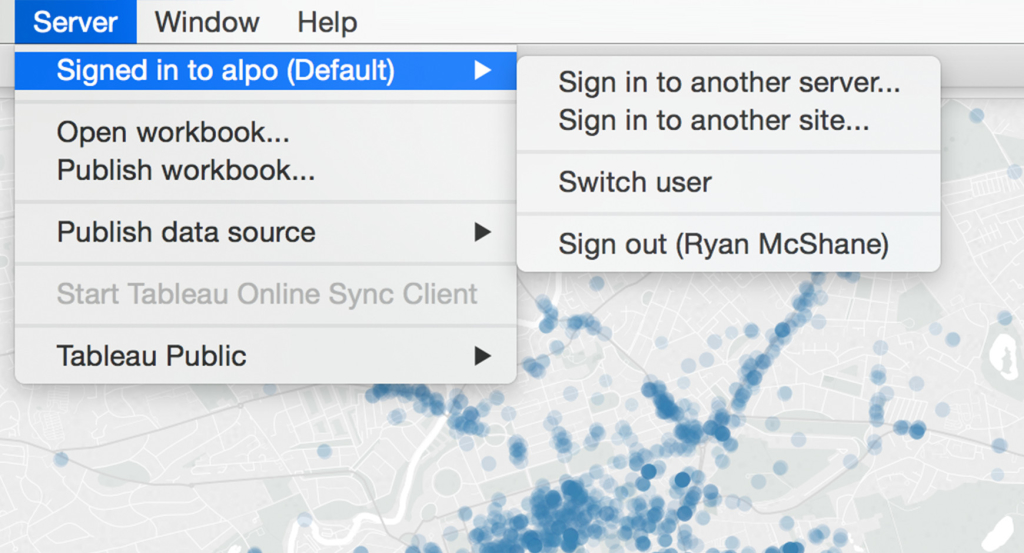
Publish your Tableau dashboards faster. Tableau Desktop remembers your Tableau Online or Tableau Server connection and signs you in to the last server you used.
____________________________________________________________
Tableau online Sync
Sync as a Service
The Online Sync Client can be configured to be “always on” and run continuously so that your data stays fresh even when you’re signed out of the sync computer.
Easy Setup
Schedule extract refreshes right from a web browser. You’re guided through the Tableau Online Sync Client setup when you publish a data source to Tableau Online.
Notifications
Sync with confidence. The Tableau Online Sync Client notifies you if a data source needs additional information such as user credentials or an updated file path.

Getting started with your data should be fast, no matter where it lives or how it looks.
Union
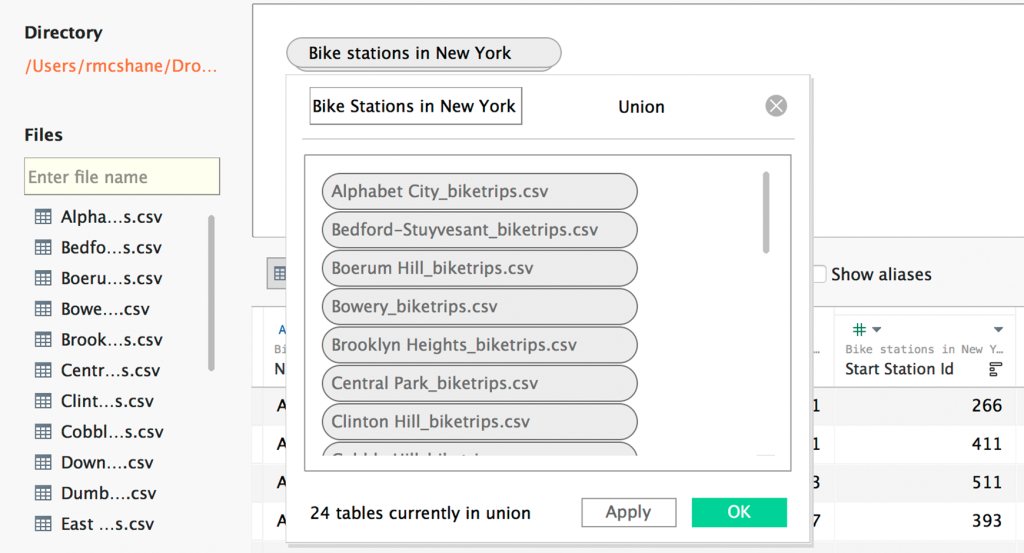
Combine data that have been split across multiple files or tables into a single Tableau data source. Excel or text-based data sources only.
____________________________________________________________
Snowflake
Connect directly to Snowflake Elastic Data Warehouse. Snowflake makes it easy for any organization to scale their data and analytics on demand
____________________________________________________________
Data Grid
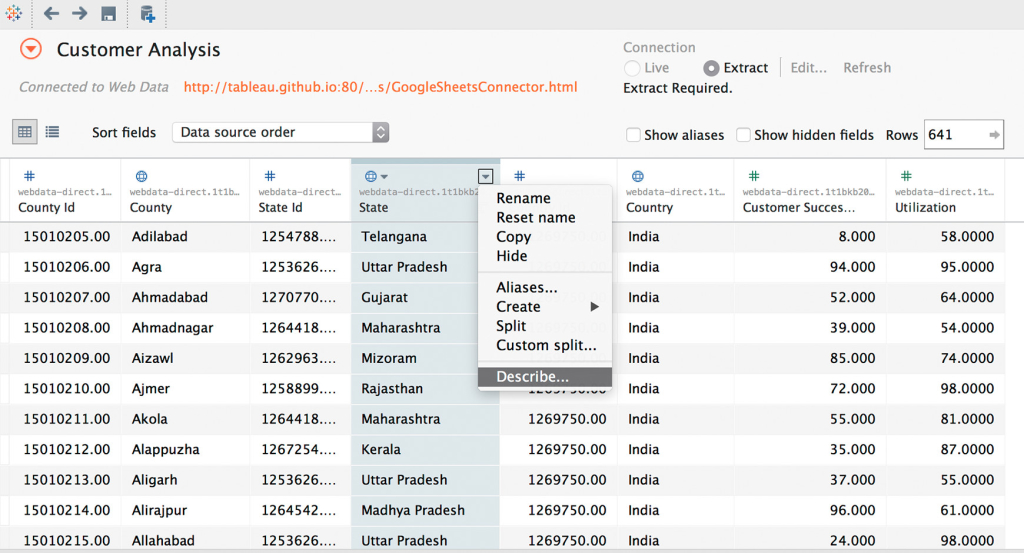
You can now preview Tableau extracts and Web Data Connector data sources on the Data Source page. Manage metadata there as well.
____________________________________________________________
Groups and Bins
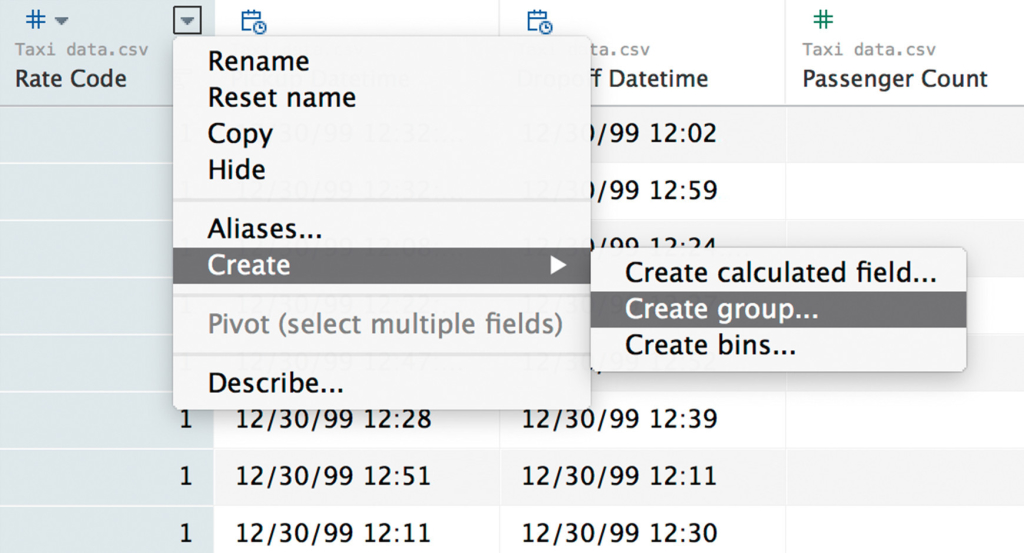
Now, right in the data grid, you can create groups and bins. Refine your data where you can see it.
____________________________________________________________
Join
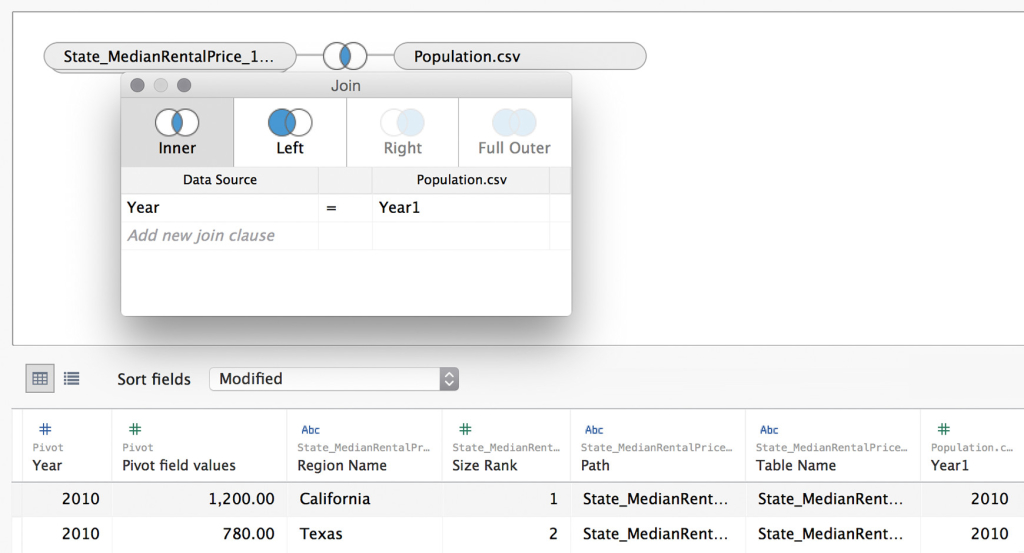
When you pivot data, Tableau creates new columns. Now you can join on those columns and use these fields for new data integration and analysis.
____________________________________________________________
Data Connections
Salesforce.com OAuth Support
Use the familiar Salesforce.com sign-in experience to sign in to Salesforce.com from Tableau Desktop, Tableau Online and Tableau Server.
Tableau Parameters in Initial SQL
You can now include parameters in an initial SQL statement for a data source. This enables new scenarios, like row-level security, where users can only see the data they are authorized to see.
Initial SQL Support
Tableau now passes initial SQL commands when connecting to Oracle, Pivotal Greenplum, and Microsoft SQL Server to set session attributes.
Kerberos for Teradata and PostgreSQL
Leverage your IT investments in enterprise data security to create a seamless single sign-on flow from Tableau all the way to your database.
____________________________________________________________
Performance
On-Demand Connections
See your data faster. When viewing a published workbook, Tableau connects only to the data sources that are required to display your view instead of connecting to all data sources in the workbook.
External Query Cache
Workbook load times and interactions are faster thanks to caching. When using Tableau Data Server, the external query cache and in-memory query caches are better synchronized.

____________________________________________________________
Maps
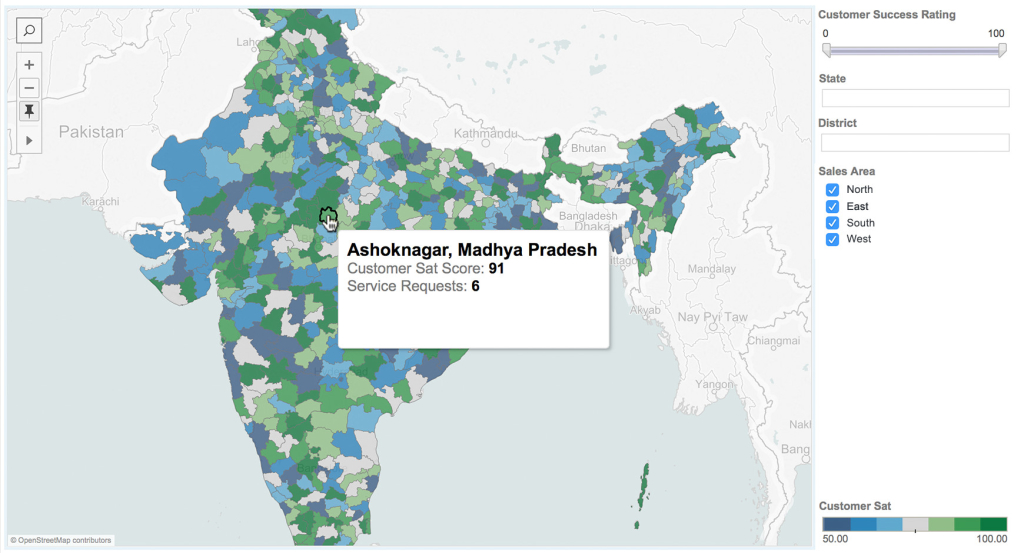
We’ve added postal codes for 39 European countries, districts in India, and US demographic data layers for 2016. We’ve also updated postal codes for UK, France, Germany, and the US.
____________________________________________________________
Forecasting
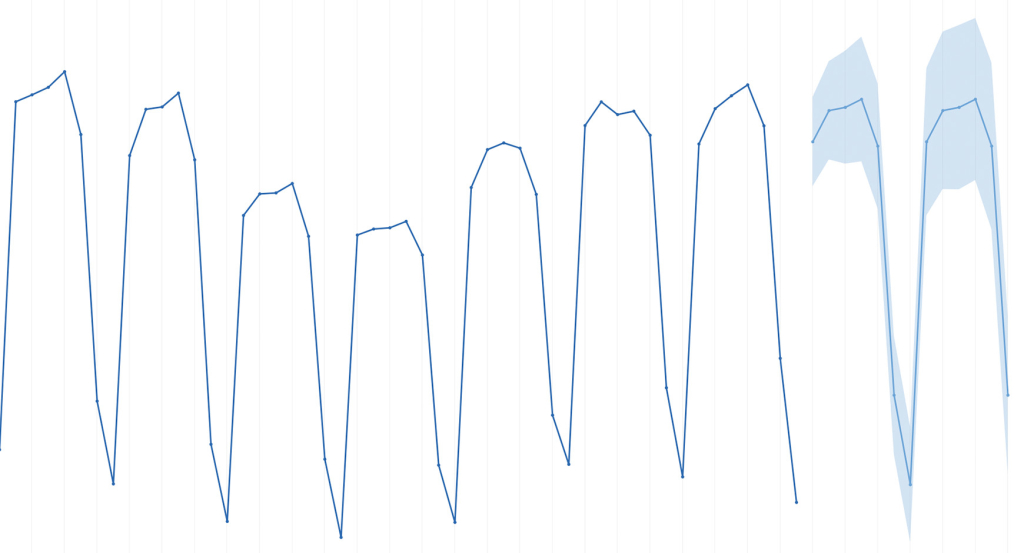
Tableau automatically selects the best season length to help you forecast odd seasonal patterns and irregular time-series. You can also forecast values ordered by an integer dimension.
____________________________________________________________
High DPI
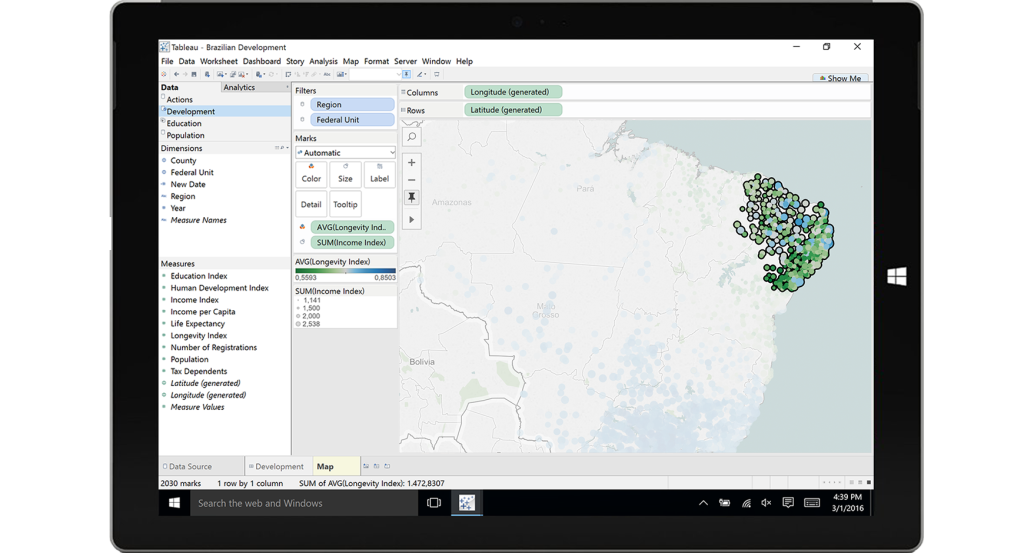
Tableau is better equipped to take advantage of high-DPI displays on Windows computers.
____________________________________________________________
Totals
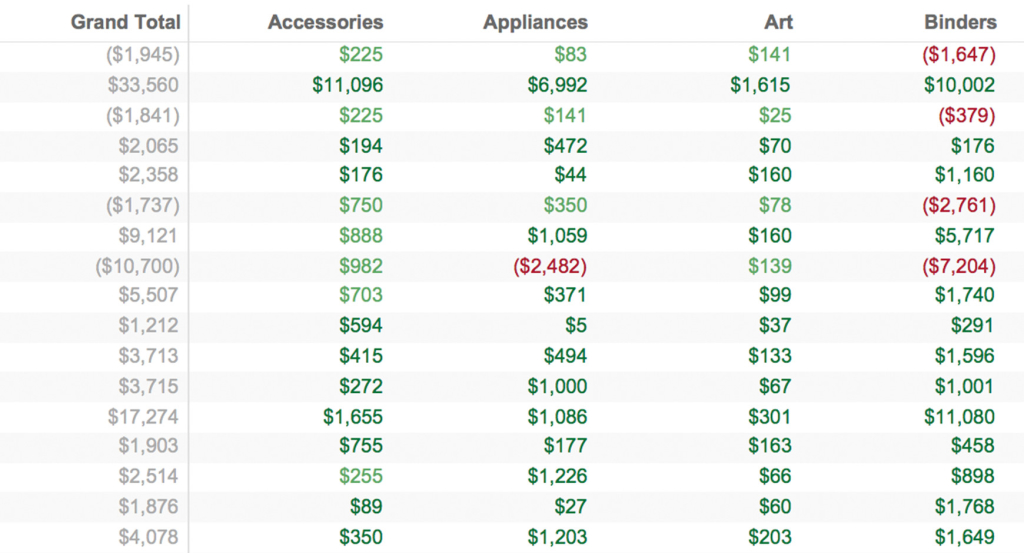
Separate your totals, subtotals and grand totals by excluding them from color-encoding.
____________________________________________________________
Sheet Colors
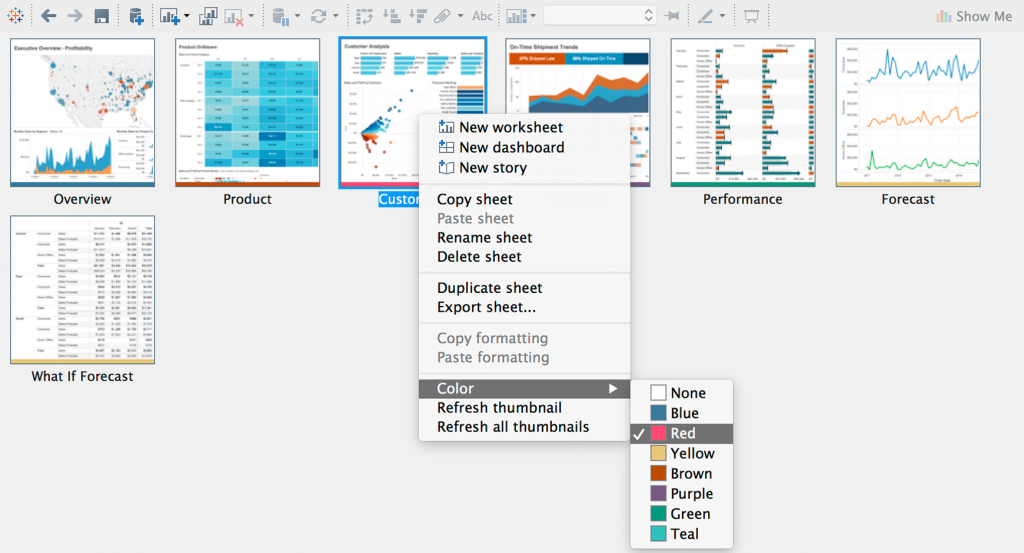
Make your worksheets easier to identify and group by adding color to the sheet tabs in the sheet-sorter and filmstrip views.
____________________________________________________________
Performance
Single-Pane Optimization
Your Tableau Online and Tableau Server Dashboards load faster, thanks to fewer required panes.
Progressive Dashboard Load
Not having to wait for the entire dashboard to load means you can start analyzing your data sooner.
Smooth Tooltips
Display smooth tooltips in all Tableau Online and Tableau Server visualizations, regardless of complexity.
[/fusion_builder_column][/fusion_builder_row][/fusion_builder_container]