When you’re building dashboards, you should use the right visualizations for the job. The chart you should use depends on the story you’re trying to tell.
A chart that works great for certain purposes can actually cause confusion in other cases. Let’s review some examples below.
Inverted-Trend Charts
Both charts below tell the same story.
Which one is easier to understand what’s happening with Debt Expenses?
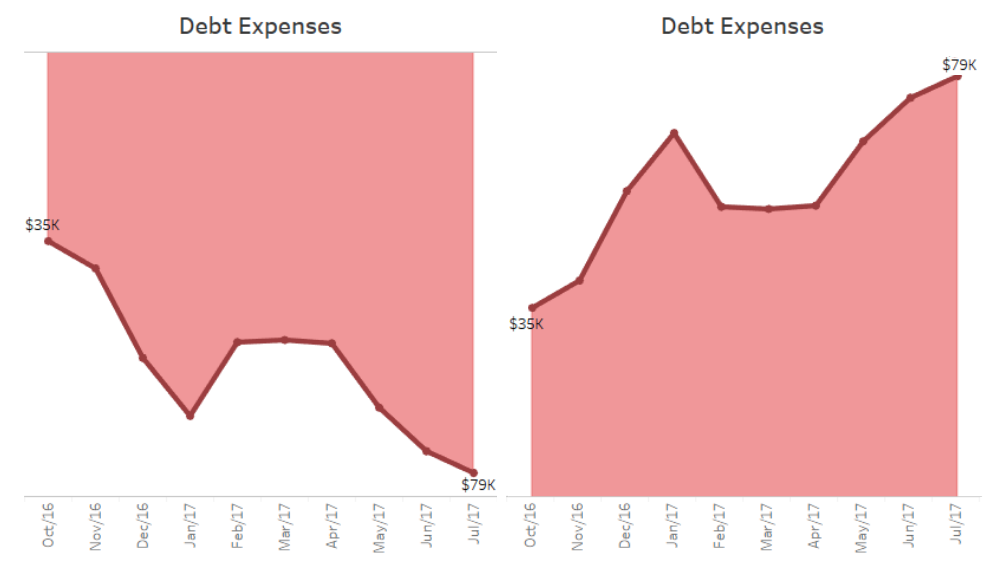
If you have a brain like the rest of us, you’ll have to look closely at the left chart to make sense of the right story—debt is growing. The right chart will give you that perspective in the blink of the eye.
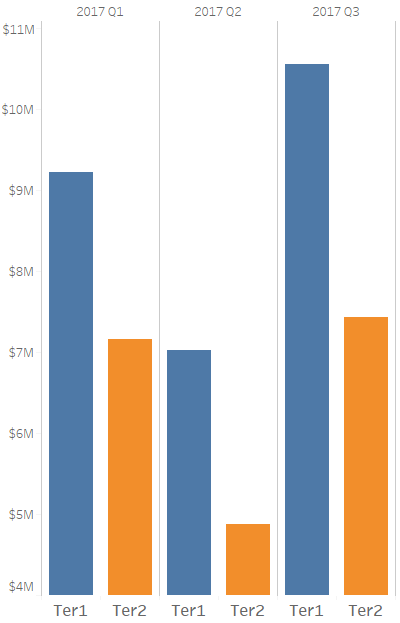
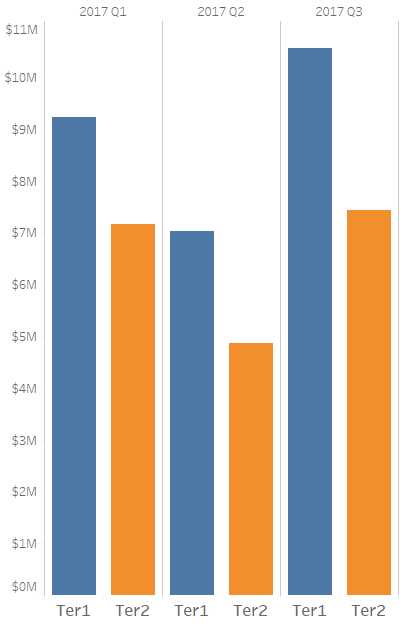
Axis with Partial Ranges
Axes with partial ranges can be very helpful as long as people viewing the charts are clearly aware of the context. So, for instance, if users know that the sales by territory are in the range of $4M to $11M, then the chart on the left can tell the story better than the chart on the right. But, if a user doesn’t know that and doesn’t look closely at the Y labels, the left chart will say that the blue territories have sales about twice as big as the orange ones.
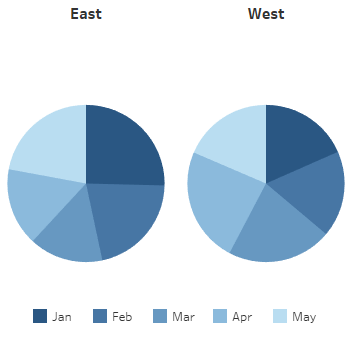
Avoid Visual Math
Try not to make people do visual math, which can be very hard.
Let’s look at an example on the charts below. What if we want to know what the market share change is over different months and different territories?
The pie charts can mostly tell that market share is about 20% ish and somehow varies. East had a great Jan and May and West did well in Apr. Anything else is hard to learn.
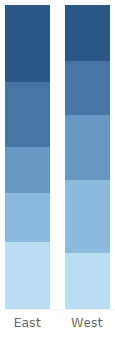
The two vertical bars show relatively easily how East compared to West by month but anything else is difficult.
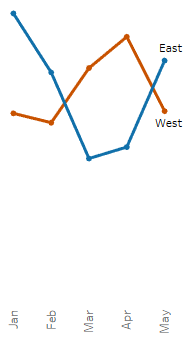
The two lines show a pretty clear picture of the market share change by month and by territory.
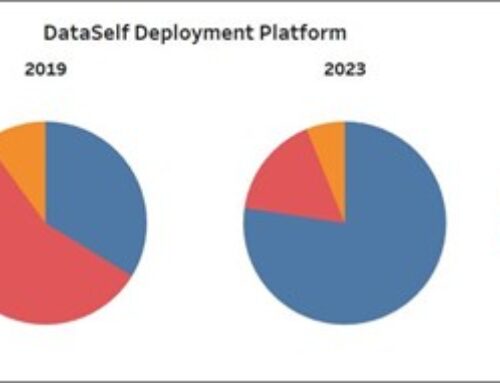
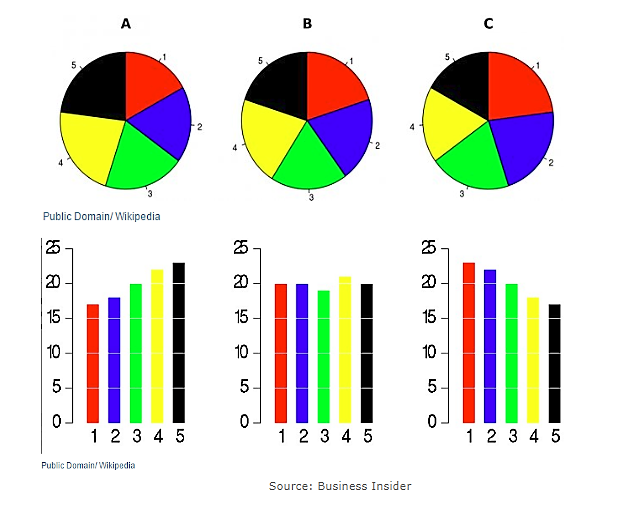
Pie Charts for Comparing Similar Data Points
Don’t use pie charts for comparing similar data points.
In the following example, each pie chart represents a sample of the market share by each category (1 through 5), taken 4 months apart. What’s going on with the market share over time? I can’t tell.
But, if you look at the same information in a bar chart, now you can see that, in the beginning, the size of the categories was related to their label (5 was the biggest), it flattened in the second period, and then reversed.
Avoid 3D Charts
3D charts sure look beautiful! But, to tell stories, they usually add distractions, visual math, and can be completely deceiving.
Take the example of 3-D pie chart below.
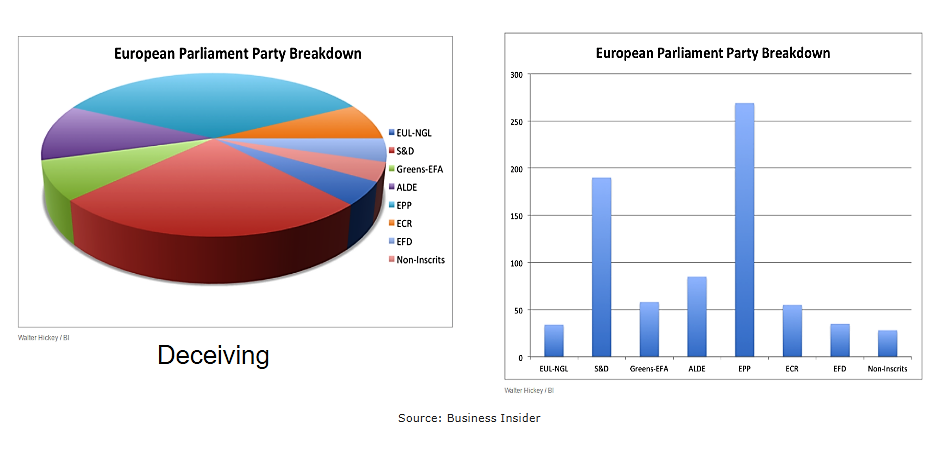
The pie chart seems to represent that S&D and EPP are about the same size. However, the bars on the right show that S&D is actually about 40% smaller than EPP.
To read more about telling your data story using dashboards, read our entire blog series by clicking on the topic below.
Introduction to Dashboards, How to Use Color, Chart Types and Formatting, Experimenting with Dashboards, Visualizations to Avoid, Layout