Understand, Anticipate and Respond to Sales Fluctuations with DataSelf’s Year Over Year Variance Report
Consistency. 
If only sales were consistent. Customers whose sales totals stayed high, items whose popularity didn’t wane, and salespeople who were equally successful with all their clients all the time…
Unfortunately, if there’s one hallmark of sales, it’s inconsistency. Clients’ tastes change, competitors emerge, and salespeople lose their mojo. Although businesses can’t necessarily control fluctuating sales, it is possible to identify them…to analyze them . . . to understand them . . . and address them. The key is having easy and consistent access to time-critical information.
But first, let’s consider the challenges of fluctuating sales. In order to know why sales are fluctuating, organizations need to be able to identify where those fluctuations are occurring. Questions like:
- Have some products become more (or less) popular?
- Does the time of year (or season) impact the sales of certain items?
- Are specific customers suddenly buying a lot more (or a lot less) than they used to?
- Have certain sales reps experienced an unusual increase or decline in their numbers?
On their own, the sales numbers associated with these metrics are relatively meaningless. For example, a product tallying $500,000 in sales for the current year would be great news if the prior year’s sales was $350,000 . . . but the news would be far more somber if the prior year clocked in at $625,000.
What’s needed are comparisons and variances. Numbers become useful only when placed in context and are compared with preceding results – results based on user-definable time ranges. Whether it’s month-to-month, quarter-to-quarter, or year-over-year, it’s only in comparison that the performance of a business can be evaluated, fluctuations spotted, and actions taken.
The Benefit of a Year over Year Variance Report
DataSelf’s “Year Over Year Variance” Report (“YOY”) provides the comparisons and variances needed to better understand, anticipate, and respond to fluctuations in sales. Decision makers appreciate this dashboard because it is great at identifying outliers. When something really good –or- really bad happens, it can be recognized early so that action can be taken immediately.
This begins with flexible (& customizable) selection criteria that enable organizations to pick exactly what elements and timeframes they wish to investigate:
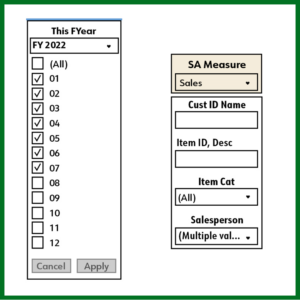
YOY Sales Variances (Customizable) Selection Criteria
By default, this report compares sales for the first 7 months of the current year against the same period in 2022. The report defaults to basing the comparison on sales revenues, but other ‘measures’ such as cost of sales, gross profit, and quantity sold may alternatively be selected.
The selection criteria may be changed (e.g., different time ranges, customers, items, categories, and salespeople). The selectable criteria may also be modified – e.g., removing ‘item category’ or adding ‘sales region’ – and such modifications require no programming expertise.
To best understand the fluctuations, sales totals need to be viewed from the top down. The YOY report begins with the ‘big picture’ (comparing total sales in one period to total sales in a preceding period) and then drills-down to increasingly detailed analytics.
The YOY continues by breaking down the fluctuations by sub-period (i.e., month), by region, and then by customer and item, as shown below:
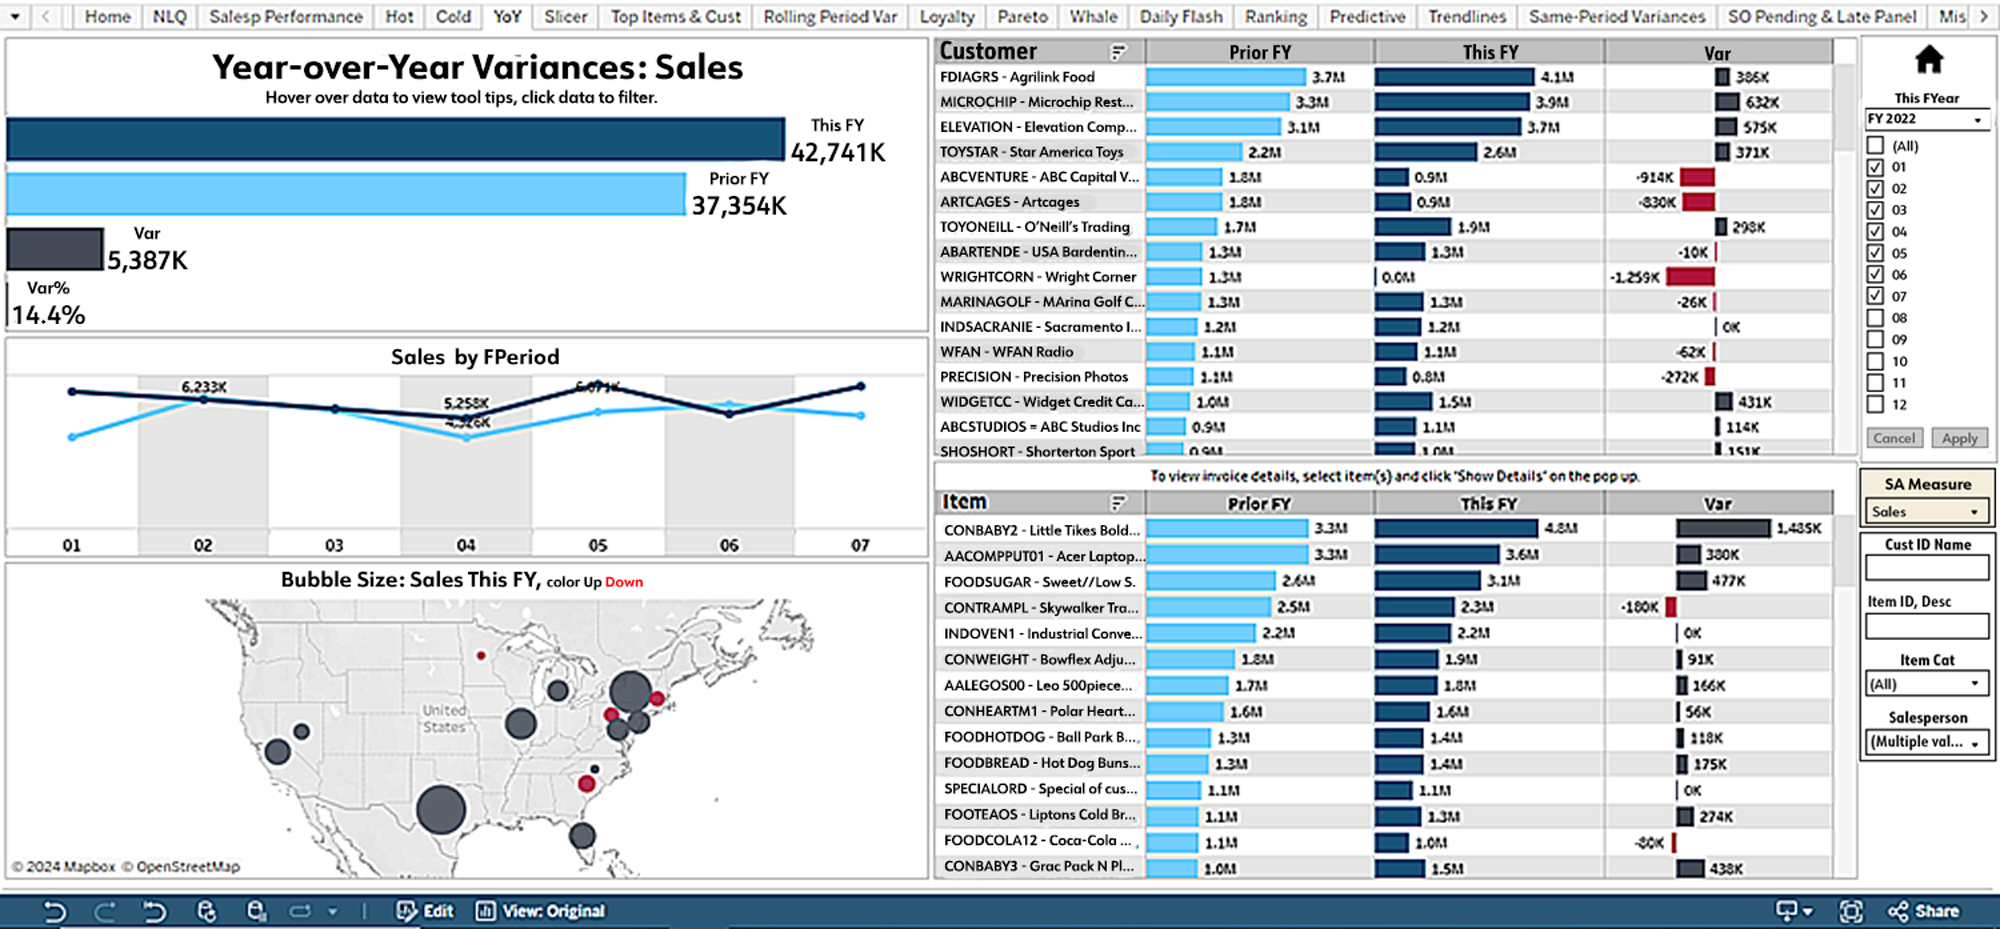
YOY Sales Variances (Customizable) Selection Criteria
Infinite Drill Down Improves Detail Visibility
The key to this report is DataSelf’s “infinite drill-down”. All of the data points are selectable; items like ‘year’ or ‘month’ can be included or excluded in the report’s results. In the map area, hovering over a data point pops up a window with the corresponding details (e.g., selected country and state, sales totals for this year and last year, plus the variances in currency and as a percentage).
Infinite drill-down is invaluable for finding out where an organization’s sales are fluctuating. For example, the preceding illustration shows the client: “Wright Corner” with a substantial (and probably unexpected) drop in sales through the first seven months of this year as opposed to the preceding year.
Having identified who has had alarming fluctuation (Wright Corner), the next step is to drill-down into their details to determine where and how that’s occurred. A single click on the client’s name reveals telling details:
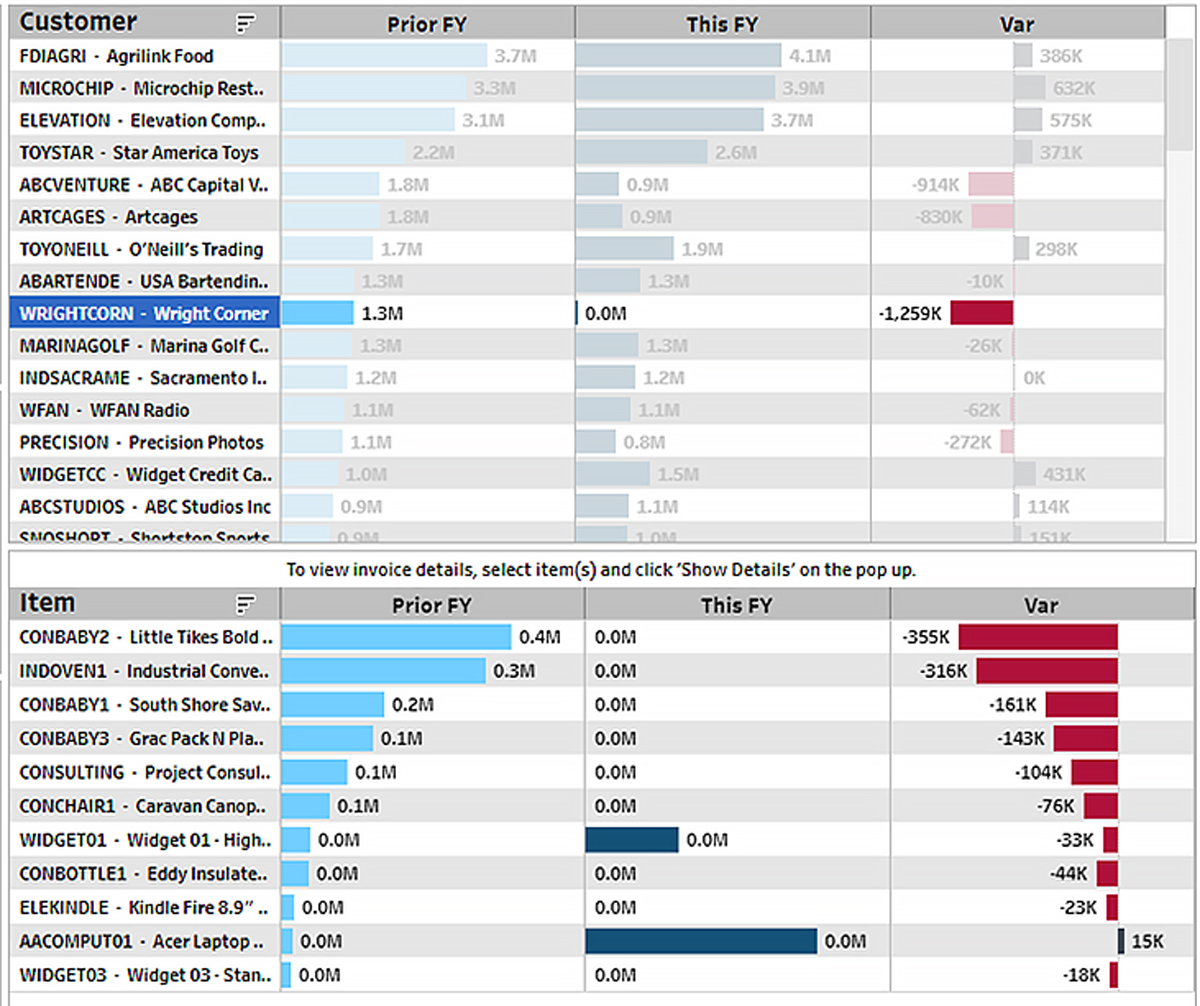
“Wright’s Corners” Causes for Decreased Sales
The lower section of this report has been transformed into a detailed display of this client’s item-specific sales numbers; the first two items show more than $670,000 in decreased sales. Armed with this information, the salesperson assigned to ‘Wright Corner’ can reach out to them and find out why their interest in these products has so suddenly – and precipitously – dropped.
This is just one example of how DataSelf’s YOY Report helps an organization identify how and why their sales are fluctuating. What’s more, the YOY Report can also uncover whether:
- Sales variances are cyclical
- The variances are beyond an acceptable level of fluctuation
- The variations are seasonal
- The variations are geographic
- The variations are tied to specific clients or products
- There is a commonality among the products or customers doing well (or poorly)
- The variations are common to specific salespeople
- A specific customer’s sales have decreased for all items, or just some items
- A salesperson’s sales have dropped for all of their clients, or just some of them
By using the YOY report, businesses can pinpoint where sales are fluctuating – and then use that information to tackle challenges and shape decisions. What’s more, shifting sales numbers can be ‘off the beaten path’ of the normal day-to-day reports. The YOY Report ensures that all data is visible to decision makers. With it, organizations are better able to anticipate, identify and appropriately respond to both the good and bad fluctuations as they occur.
View DataSelf’s Year over Year Variances Dashboard in action.